


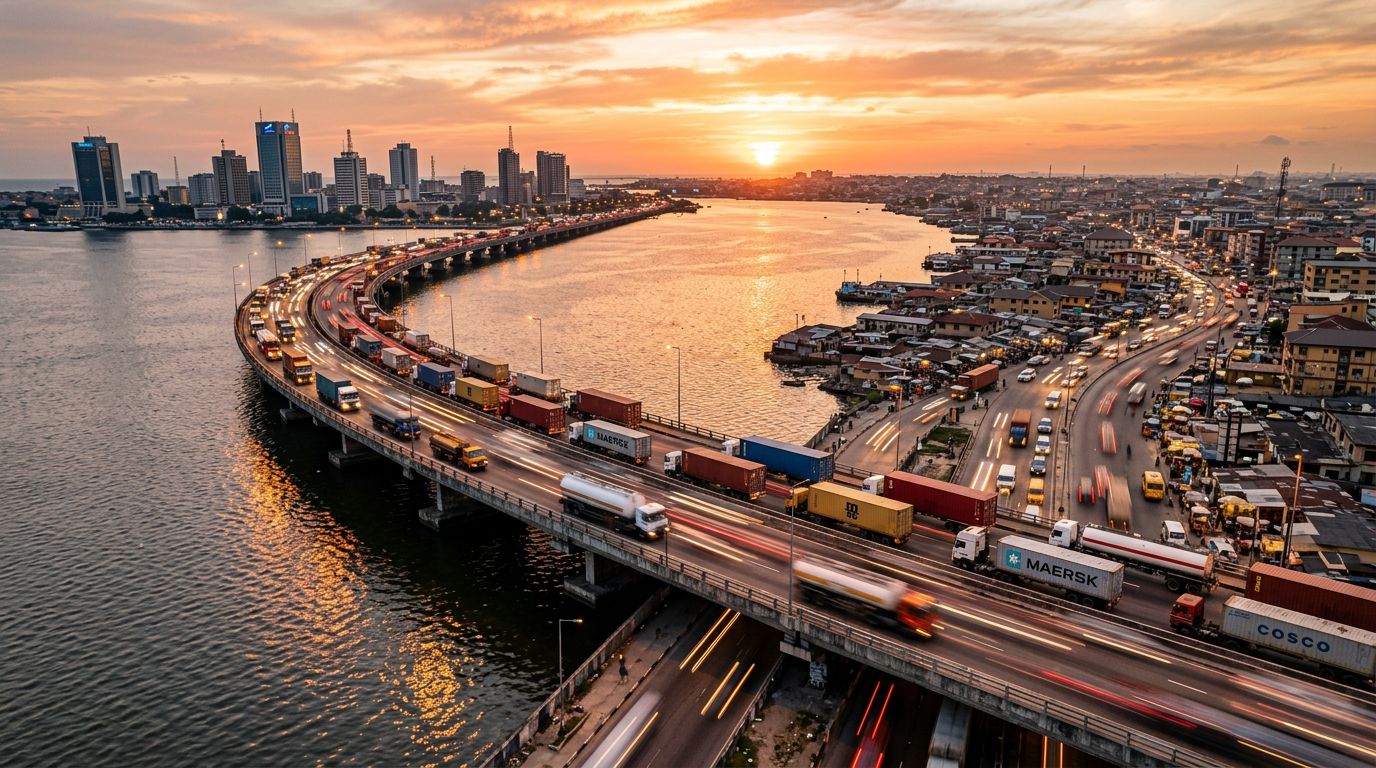
Crossing the Third Mainland Bridge should not erase your margins. For many Lagos businesses, the 20–30 km gap between the Mainland and Island hubs (Victoria Island, Lekki, Ikoyi, Ajah) is one of the city’s biggest cost drivers.
The hidden cost is not a toll. It shows up in idle time, extra fuel, faster vehicle wear, and missed deliveries. For shippers and logistics managers, understanding these real costs is essential. This guide from Compton Green Express explains the numbers, the risks, and the practical moves that keep costs down without hurting service.
The Economic Divide: Why Mainland–Island Trips Are Expensive
Lagos operates like two connected markets:
– Mainland: Ikeja, Apapa, Oshodi — manufacturing, imports, and warehousing.
– Island: Victoria Island, Ikoyi, Lekki, Ajah — high-value commercial districts and premium consumers.
Goods must cross one of three bridges: Third Mainland, Eko, or Carter. A simple map trip becomes a complex operation with volatile costs. Companies that master cross-lagoon efficiency win on price, speed, and customer satisfaction.
What Really Drives Cost: Fuel, Time, and Wear
Cost goes far beyond pump prices. Here are the major drivers and what to expect.
Fuel Consumption and Price Volatility
– Typical loaded truck, Ikeja → Victoria Island: about 15–25 liters of diesel per crossing (vehicle, load, and traffic dependent).
– Diesel at ₦650–₦750/liter (2024): ₦9,750–₦18,750 per crossing in fuel alone.
– Peak traffic on Third Mainland Bridge can push fuel use up by 40–60% due to stop-and-go driving.
– Peak periods (7:00–10:00 AM, 4:00–8:00 PM) often turn a 45-minute trip into 2.5–3.5 hours.
For fleets making two round trips daily, expect 120–200 liters weekly just for Mainland–Island runs — ₦78,000–₦150,000 per vehicle per week.
Time Cost and Driver Productivity
Time in traffic reduces delivery capacity. When a driver spends three hours on a crossing, fewer stops are completed.
– Typical driver compensation: ₦80,000–₦150,000 monthly plus allowances.
– If a driver completes four deliveries in an 8-hour shift, labor cost might be ₦1,250–₦2,345 per delivery.
– Stuck in traffic and completing only two deliveries, the cost can jump to ₦2,500–₦4,690 per delivery.
Compton Green Express helps reduce time-based costs through strategic routing and delivery windows. Explore our freight forwarding approach: [freight forwarding services in Nigeria](https://comptongreenexpress.com/services/freight-forwarding).
Vehicle Depreciation and Maintenance
Stop-and-go driving accelerates wear:
– Brake replacements: every 6–9 months vs. 12–18 months in lighter urban use.
– Clutch replacements: 30–40% more frequent.
– Engine overhauls: needed 20,000–30,000 km earlier.
– Tires: 25–35% faster wear.
Estimated impact: ₦50,000–₦85,000 per vehicle monthly tied to bridge conditions.
Opportunity Cost of Delays
Late deliveries can lead to:
– Client dissatisfaction or churn
– SLA penalties
– Reduced capacity to accept new work
– Brand damage in competitive bids
These indirect costs compound over time.
The Bridge Variable: Infrastructure That Moves Your Margins
Road remains dominant but is often the least efficient cross-lagoon method. Bridge conditions and maintenance cycles directly affect fuel, time, and reliability.
Third Mainland Bridge: The Critical Chokepoint
– Length: 11.8 km; daily volume: estimated 180,000–200,000 vehicles.
– Maintenance and lane closures push traffic to Eko and Carter bridges, creating severe congestion.
During major repairs (e.g., 2020–2021), operators reported:
– Crossings rising from 45 minutes to 4–6 hours
– Fuel per trip doubling or tripling
– Missed schedules and lost clients
Even a single lane closure at peak can add 90–150 minutes and ₦5,000–₦12,000 per trip in combined costs.
Peak-Hour Pricing and Scheduling
Choose your windows wisely:
– Best: 10:00 PM–5:00 AM (35–45 minutes)
– Better: 10:00 AM–3:00 PM (60–90 minutes)
– Worst: 7:00–10:00 AM, 4:00–8:00 PM (150–240 minutes)
Shifting to optimal windows can lower per-crossing costs by 60–75%. This works best with staging capacity and planning.
Weather and Seasonal Effects
– Rainy seasons (Apr–Jul, Sep–Nov) raise congestion and accident risk.
– Expect crossing times to increase 30–50% in heavy rain.
Plan for seasonal variance in annual budgets.
Barging Into Efficiency: When Water Wins
Waterways (Lagos Lagoon and channels) bypass bridges. For bulk and containerized cargo, barges can cut costs and reduce risk.
Cost Comparison (Indicative Mainland → Victoria Island)
– Road: ₦8,500–ₙ12,000 per ton (fuel, time, vehicle costs)
– Barge: ₦4,500–₦7,000 per ton (including handling)
Savings of roughly 35–45% for suitable cargo. Barges can also bypass Apapa road congestion by using alternative terminals and Island-side jetties.
Constraints to Consider
– Limited Island jetties with direct truck access
– Best for bulk, pallets, and containers; not ideal for urgent small parcels
– Fixed schedules (often 2–3 departures daily)
– Occasional weather suspensions
Best-Fit Use Cases
– Construction materials for Island projects
– Bulk consumer goods to retail DCs
– Manufacturing inputs to Island plants
– Containers moved from Apapa to Island warehouses
For more on mode choices, see: [Lagos multimodal transport options](https://comptongreenexpress.com/resources/lagos-transport-modes).
The Island Hub Strategy: Cut Crossings, Boost Density
Placing inventory closer to demand converts volatile daily costs into a predictable warehouse expense.
Island vs. Mainland Warehouse Costs (per sqm monthly)
– Island: Victoria Island ₦4,500–₦7,500; Lekki Phase 1 ₦3,000–₦5,000; Ajah/Sangotedo ₦2,000–₦3,500
– Mainland: Ikeja ₦2,500–₦4,000; Apapa ₦2,000–₦3,500; Ilupeju ₦1,800–₦3,000
Island space costs more, but crossings add up. Example: 20 weekly trips at ₦18,000 each total ₦18.72M annually. A 200 sqm Island warehouse at ₦4,000/sqm is ₦9.6M per year — about 49% less, with faster service.
Consolidation and Bulk Transfers
– Replace many small trips with weekly or bi-weekly full loads (truck or barge).
– Cut crossings from 100+ per month to 4–8.
– Use off-peak windows to lower costs.
You’ll need space for 1–2 weeks of stock, but the savings usually cover the investment quickly.
Last-Mile From Island Hubs
Keeping vehicles on the Island improves delivery density:
– Fuel per delivery: down 60–70%
– Driver time per delivery: down 50–65%
– Vehicle wear per delivery: down 55–70%
For e-commerce and multi-drop routes, Island hubs often pay back within 6–9 months.
Case Study: Modern Lagos Logistics, Reworked
Baseline: road-only operations for a mid-sized consumer goods distributor.
– Mainland warehouse (Ikeja, 500 sqm @ ₦2,800): ₦1.4M/month
– 4 vehicles making 2 round trips daily to Island
– Peak-hour exposure; rising fuel and delay costs
Monthly totals (indicative):
– Warehouse: ₦1,400,000
– Fuel (8 crossings/day × 22 days × ₦15,000): ₦2,640,000
– Drivers (4 × ₦120,000): ₦480,000
– Maintenance: ₦340,000
– Total: ₦4,860,000 | Per delivery: ₦27,614 (176 deliveries)
Optimized model: hybrid with an Island hub.
– Mainland 300 sqm: ₦840,000
– Island 250 sqm (Lekki @ ₦3,500): ₦875,000
– Weekly off-peak bulk transfers (4 × ₦12,000): ₦48,000
– Island last mile fuel: ₦420,000
– Drivers (3 × ₦120,000): ₦360,000
– Maintenance: ₦180,000
– Total: ₦2,723,000 | Per delivery: ₦15,470 (176 deliveries)
Results:
– 44% lower total monthly cost (₦2.14M saved)
– 44% lower per-delivery cost
– Annual savings: ~₦25.6M
– On-time rate: 73% → 94%
– Volume growth: +12%
Success factors:
1. Measured true per-delivery cost
2. Kept sufficient Island inventory to avoid emergency peak crossings
3. Scheduled bulk transfers off-peak (10 PM–5 AM)
4. Right-sized an Island-only fleet
5. Used inventory controls to prevent stockouts
Practical Recommendations
For high-volume Island shippers (10+ weekly deliveries):
– Establish an Island distribution hub.
– Move restocking to off-peak hours.
– Right-size vehicles for Island-only routes.
For medium-volume shippers (3–9 weekly deliveries):
– Use shared or co-warehousing on the Island.
– Consolidate to fewer, fuller crossings.
– Leverage 3PLs with existing Island infrastructure.
For all operators:
– Avoid peak-hour crossings where possible.
– Track actual per-crossing costs (fuel, time, wear).
– Evaluate barge options for suitable freight.
– Use GPS and route optimization.
– Keep contingency plans for bridge maintenance cycles.
What’s Next for Mainland–Island Logistics
– Infrastructure: Fourth Mainland Bridge is in the pipeline, but plan for current realities.
– Water transport: Jetty and terminal investments are growing, widening barge use cases.
– E-commerce: Island demand growth strengthens the Island hub case.
– Digital tools: Real-time traffic and predictive planning can add 10–15% efficiency.
How Compton Green Express Can Help
Compton Green Express supports Lagos businesses with data-driven planning, multimodal strategies, and practical execution.
– Analyze your current per-delivery costs
– Identify Island hub opportunities and off-peak schedules
– Design bulk transfer plans (road and water, where suitable)
– Implement last-mile routes that raise delivery density
Do not let bridge traffic drain your profits. Contact our team for a customized cost-efficiency review of your Mainland–Island operations.
– Call: +234 (0) 1-888-5500
– Visit: https://comptongreenexpress.com
– Learn more: [freight forwarding services in Nigeria](https://comptongreenexpress.com/services/freight-forwarding) | [Lagos multimodal transport options](https://comptongreenexpress.com/resources/lagos-transport-modes)