


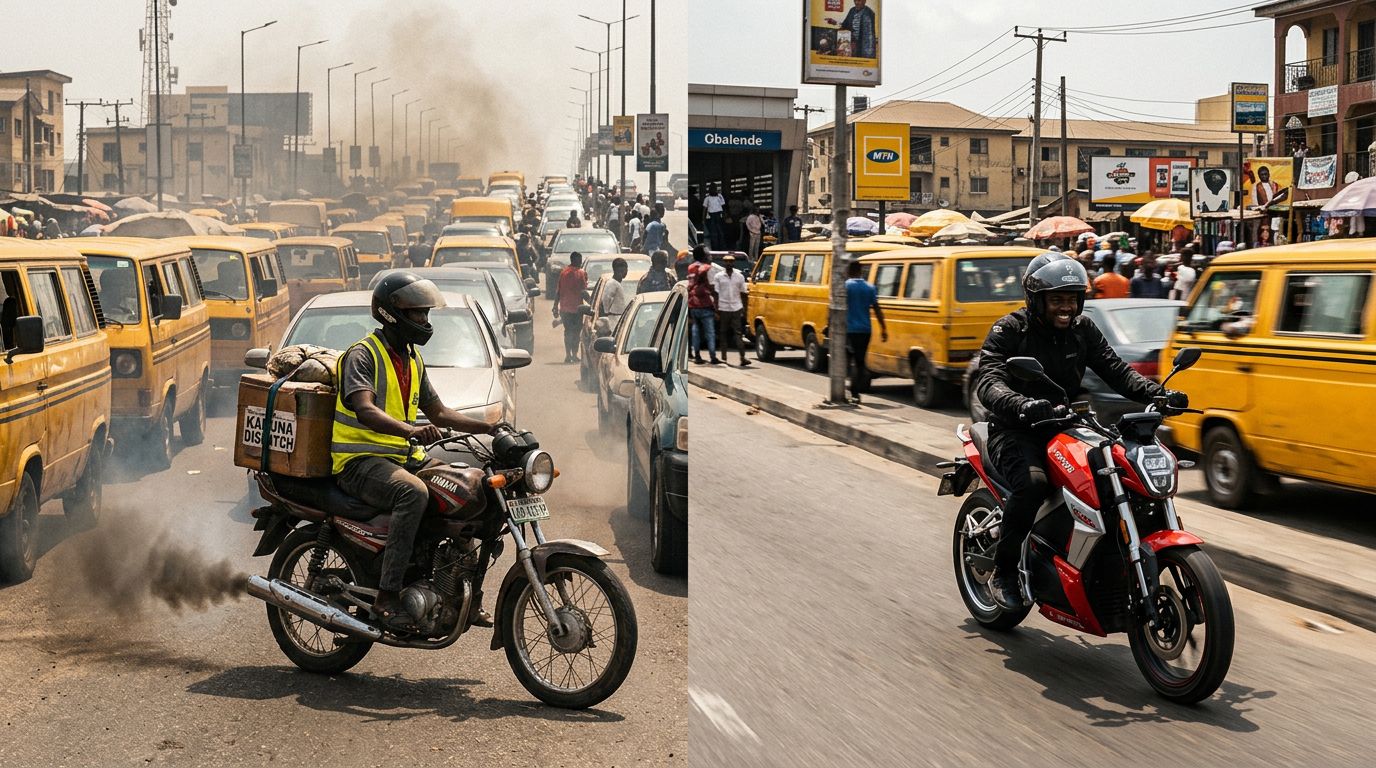
In Lagos gridlock, one choice can reshape same‑day delivery costs. Petrol prices keep rising, and downtime hurts margins. Many operations now ask a simple question: should we go electric?
For courier teams in Lagos, efficiency is survival. Every naira spent on fuel, every hour lost to maintenance, and every refuel stop affects reliability and profit. This guide compares electric and petrol courier bikes for Lagos conditions, using 2024 assumptions and practical examples. Figures here are estimates for planning, not guarantees.
The Efficiency Equation: Distance vs. Time in Lagos Traffic
How stop‑and‑go traffic changes everything
Lagos riders spend much of the day stationary or crawling under 10 km/h. That reality shifts the math.
Petrol engines face disadvantages in heavy traffic:
– Idling burns fuel without moving.
– Stop‑start driving can raise consumption by about 30% vs. open roads.
– Frequent acceleration and braking may drop efficiency to 15–20 km/l.
– Wear increases with constant clutch and gear use.
Electric motors work well in these conditions:
– No energy use when stopped (no idling).
– Regenerative braking recovers energy during deceleration.
– Consistent efficiency at low speeds.
– Strong torque from standstill for quick getaways.
For dense routes across Victoria Island, Ikeja, Yaba, Lekki, and Surulere, these differences affect real operating costs.
Real‑world range considerations
Typical same‑day routes cover 80–150 km with 15–30 drops.
Petrol bike range (example):
– 10–15 L tank. At 20–25 km/L in traffic, expect 200–300 km per fill.
– Fuel stations are common, so range anxiety is rare.
Electric bike range (example):
– 60–100 km per charge in ideal conditions; often 50–80 km in Lagos heat with cargo.
– Many riders will need a midday top‑up for full‑day work.
Planning and access to charging reduce the impact of this gap.
Cost Breakdown: Fuel vs. Charging in Nigeria
Daily operational costs (example, 2024 Lagos)
Scenario: One courier bike covers 120 km/day.
Petrol courier (estimate):
– 120 km at ~20 km/L → 6 L fuel.
– Petrol price ~₦650–₦750/L (avg ₦700).
– Daily fuel cost ≈ ₦4,200.
– Monthly (25 workdays): ≈ ₦105,000.
Electric courier (estimate):
– 120 km at ~17.5 kWh/100 km.
– Energy use ≈ 21 kWh.
– Power cost ~₦60–₦80/kWh (avg ₦70).
– Daily charging ≈ ₦1,470.
– Monthly (25 workdays): ≈ ₦36,750.
Illustrative savings: about ₦68,250/month per bike, or roughly 65% lower energy cost. A 10‑bike team could save over ₦682,500/month on energy alone. Actual results vary by route, rider style, and tariffs.
Hidden costs and savings
Petrol bikes typically need:
– Oil changes every 2,000–3,000 km.
– Periodic air filters and spark plugs.
– More brake wear (no regen).
– Higher engine wear from stop‑start use.
Electric bikes typically avoid:
– Oil, spark plugs, and exhaust maintenance.
– Many moving parts (often 40% fewer service items).
– Brake wear reduced by ~30–50% via regen.
Battery replacement is a key electric cost. Many packs last 3–5 years or 40,000–60,000 km. Replacement can run about ₦400,000–₦800,000, depending on capacity. Plan this into long‑term budgets.
Maintenance and Longevity on Lagos Roads
Infrastructure impact
Potholes, flooding, and heat affect all vehicles.
Petrol engine considerations:
– Dust can clog air filters faster.
– Idling raises carbon buildup risk.
– Heat stress in slow traffic.
– Fuel system sensitivity to quality.
– Clutch wear from frequent shifting.
Electric motor considerations:
– Sealed motors resist dust and moisture better.
– No combustion → no carbon buildup.
– Lower heat at low speeds.
– Single‑speed drive avoids clutch wear.
Many Lagos couriers report petrol service every 3–4 months vs. 6–8 months for major electric service, assuming proper care.
Reliability for same‑day promises
Petrol bikes:
– Mature tech and broad mechanic support.
– Parts widely available.
– Fast refueling anywhere.
Electric bikes:
– Fewer failure points.
– Battery management helps protect packs.
– Fewer specialized technicians and parts on hand.
– Charging network still growing.
For mission‑critical [same‑day dispatch](https://comptongreen.express/services), roadside petrol support remains a strength. Well‑maintained electrics, however, can be very reliable day to day.
The Same‑Day Challenge: Reliability and Range
Range anxiety vs. refueling convenience
Petrol advantage:
– Many filling stations citywide.
– Five‑minute refuel can add 200–300+ km.
Electric reality:
– Limited public chargers today.
– Practical setups include base charging, some home charging, and planned midday top‑ups.
– Routes that return to hub enable fast turnarounds.
Fast charging options are emerging. Some delivery‑focused e‑bikes can reach ~60–80% in 45–60 minutes, making lunch charging viable.
Performance in Nigerian heat
Petrol:
– Risk of heat soak and rider discomfort from engine heat.
Electric:
– Possible 10–15% range impact in high heat.
– Thermal management uses some energy.
– Cooler and quieter ride experience.
Both can perform well when maintained for local conditions.
Total Cost of Ownership: A 3‑Year Look (Example)
Upfront prices (illustrative):
– Petrol courier bike: ~₦450,000–₦800,000.
– Electric courier bike: ~₦800,000–₦1,500,000.
Three‑year TCO example for 120 km/day (assumptions only):
Petrol bike:
– Purchase: ₦600,000
– Fuel (36 months): ₦3,780,000
– Maintenance/repairs: ₦450,000
– Oil changes: ₦180,000
– Insurance/licensing: ₦150,000
– Total ≈ ₦5,160,000
Electric bike:
– Purchase: ₦1,200,000
– Charging (36 months): ₦1,323,000
– Maintenance/repairs: ₦200,000
– Insurance/licensing: ₦150,000
– Total ≈ ₦2,873,000
Illustrative 3‑year difference: ≈ ₦2,287,000 per bike. Break‑even often appears in 12–18 months, then savings compound. Real outcomes depend on routes, power tariffs, and maintenance practices.
Environmental Considerations
Petrol impacts:
– About 2.3 kg CO₂ per liter burned.
– With ~6 L/day, emissions can reach ~13.8 kg/day.
– Noise and local air pollution.
Electric benefits:
– Zero tailpipe emissions during operation.
– Quieter in residential areas.
– Indirect emissions depend on grid mix.
For brands building a modern, lower‑impact profile, electric helps reduce urban noise and local pollution.
Infrastructure Reality Check in Lagos
Charging today:
– Some malls and offices offer charging.
– Specialized charging businesses are emerging.
– Home and base charging are most reliable.
Power reliability:
– Grid instability requires planning.
– Generators or solar can provide backup at hubs.
– Daytime solar can offset charging costs.
Many teams invest in hub solar to improve uptime and predictability.
Case Examples (Lagos Operators)
Single‑bike operator (illustrative):
– Electric bike purchase: ~₦1.1m; simple home charging setup.
– Monthly energy savings aligned with the daily example above.
– Reported lower downtime and quieter neighborhood deliveries.
Medium fleet (illustrative):
– Five of 15 bikes go electric.
– Invest in a workplace charging station.
– Energy and maintenance costs drop; routes optimized for midday top‑ups.
These examples show typical patterns. Results vary by route length, rider behavior, and charging access.
Making the Right Choice for Your Lagos Operation
When petrol still makes sense:
– Routes often exceed 100 km without a hub return.
– No charging access on route or at base.
– Budget blocks higher upfront spend.
– Daily service areas change unpredictably.
When electric delivers value:
– Daily routes are under ~80 km or allow midday charging.
– Base power is reliable.
– You plan 12+ months ahead.
– Work is concentrated in urban cores.
– Fuel costs pressure margins.
– You aim for a modern, lower‑noise, lower‑emission profile.
Transition Strategy: Hybrid First
Phase 1: Pilot 1–2 electric bikes
– Map ideal routes.
– Train riders on charging and regen.
– Set maintenance routines.
Phase 2: Assign electrics to repeatable runs
– Dense inner‑city routes.
– Corporate loops.
– Residential clusters.
– Midday return to base for top‑ups.
Phase 3: Keep petrol for
– Long, irregular, or urgent jobs.
– Areas with no charging.
– Backup coverage.
Financial planning tips
1. Calculate break‑even using your own route data and tariffs.
2. Consider financing to spread upfront costs.
3. Track fuel price trends; rising petrol improves electric ROI.
4. Budget for battery replacement in years 4–5.
5. Watch for evolving EV incentives or tariffs.
Conclusion: What This Means for Compton Green Express
This decision is not about which technology is “best” in general. It is about fit for Lagos routes and service promises.
What the 2024 examples suggest:
– Electric can cut daily energy costs by roughly 60–65% in many cases.
– Three‑year total cost of ownership may favor electric by over ₦2m per bike.
– Maintenance needs often drop with simpler drivetrains.
– Lagos traffic patterns highlight electric strengths.
– Infrastructure limits require planning, not perfection.
How to succeed:
– Assess your exact routes and return‑to‑base patterns.
– Confirm charging access and backup power.
– Plan financing and maintenance.
– Transition in phases to protect flexibility.
Compton Green Express focuses on reliable, cost‑effective same‑day dispatch designed for Lagos realities. If you are exploring the right fleet mix for your routes, contact our team to discuss options and planning based on your data.
Ready to optimize your Lagos dispatch operations? Explore how a thoughtful mix of electric and petrol can balance cost, reliability, and sustainability for your business. Visit our [services](https://comptongreen.express/services) and [fleet](https://comptongreen.express/fleet) pages to learn more and get in touch.